










Cape Town homes sell faster and closer to asking price

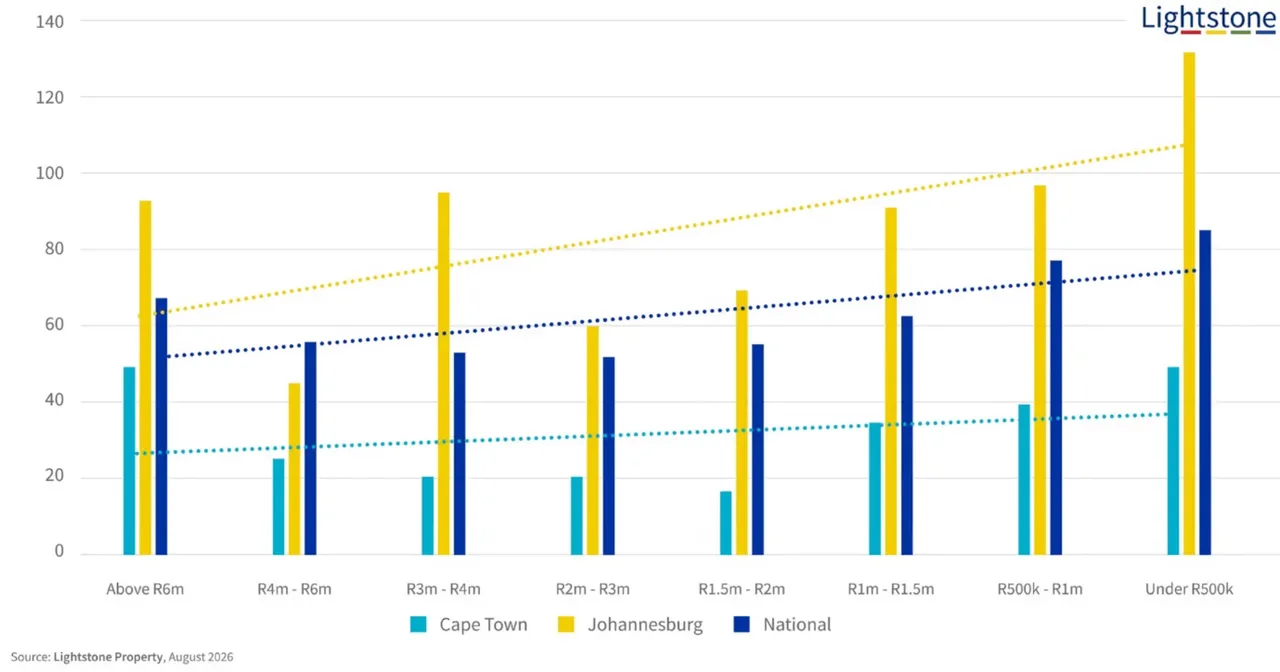
- Cape Town homes sold faster than Johannesburg properties across every price band measured by Lightstone in Q1 2026.
- R1.5m - R2m Cape Town homes recorded a median 16 days on market, versus Johannesburg's fastest segment at 45 days.
- Johannesburg sellers were more likely to cut asking prices, pointing to greater buyer negotiating power than in Cape Town.
Two cities, two very different property markets
Cape Town's residential market is moving significantly faster than Johannesburg's, with sellers also less likely to cut asking prices to secure a deal.
South Africa's two largest residential property markets are increasingly telling different stories. Cape Town has benefited from sustained demand, investment, inward migration and rising residential property values, although affordability remains an increasing challenge.
Johannesburg, meanwhile, continues to offer considerably lower entry prices across many suburbs and potentially attractive yields for investors. But parts of the market have been constrained by weaker sentiment, infrastructure challenges and concerns around municipal governance and service delivery.
Now, new analysis from Lightstone Property provides another way of measuring the divergence: how quickly properties actually sell and how much negotiating sellers have to do to get deals across the line.
The findings are striking. Residential properties sold faster in Cape Town than Johannesburg across every price band analysed in Q1 2026. Johannesburg also lagged the national median time-on-market in all but one price category.
Time-on-market is an important indicator of residential market liquidity. Shorter selling periods can point towards stronger demand, constrained supply, appropriate pricing or particularly desirable locations. Longer selling periods can indicate weaker demand, excess stock, unrealistic seller expectations or greater negotiating power for buyers.
Nationally, the market has also become more liquid. Recent figures put the average selling period at approximately 10 weeks and six days in Q2 2026, compared with around 12 weeks and one day in Q1 2025. But beneath that national improvement, the performance of Cape Town and Johannesburg is markedly different.
Cape Town wins the race to the 'Sold' sign
The most dramatic difference identified by Lightstone occurs at the affordable end of the market.
“In Q1 2026, affordable properties valued at less than R500 000 took the longest to sell in Johannesburg at a median of 132 days, compared to just 49 days in Cape Town and the national median of 85 days,” says Esteani Marx, Business Development Executive at Lightstone Property.
“This suggests a difficulty in qualifying for bonds could be holding the affordable market segment back.”
That's an 83 day difference between Johannesburg and Cape Town in the same price bracket. The fastest-moving segments also reveal very different market dynamics.
“Johannesburg's best performers in terms of time-on-market at 45 days were homes valued at between R4 million and R6 million, while in Cape Town sellers of homes between R1.5 million and R2 million waited a median of just 16 days to put the ‘Sold’ sign up,” says Marx.
At the top of the market, transactions naturally take longer. Properties above R6 million recorded a median 49 days on market in Cape Town, compared with 93 days in Johannesburg and 67 days nationally.
Median time-on-market by price band: Cape Town vs Johannesburg vs SA - Q1 2026
This should definitely be published. It is the single most important graph because readers can immediately see the performance gap across the entire market.
The R3m - R4m market shows the longer-term divergence A single quarter can be distorted by seasonality, transaction volumes or changes in stock, so Lightstone also examined performance over a longer period.
The R3 million to R4 million price bracket provides a particularly revealing comparison. Cape Town's median time-on-market in this segment has steadily declined from 48 days in Q1 2024 to just 20 days in Q1 2026.
Johannesburg's trajectory has been considerably more volatile, including a spike in Q1 2026 similar to the pattern recorded in Q1 2024.
For investors, this matters. Time-on-market isn't simply about how quickly an owner can sell. It can also provide an indication of market liquidity and exit risk.
Two properties might produce similar rental yields, but an asset in a market where buyers consistently transact more quickly could offer an investor considerably greater flexibility when the time comes to realise their capital.
Median time-on-market for R3m - R4m listings: 2024 -2026
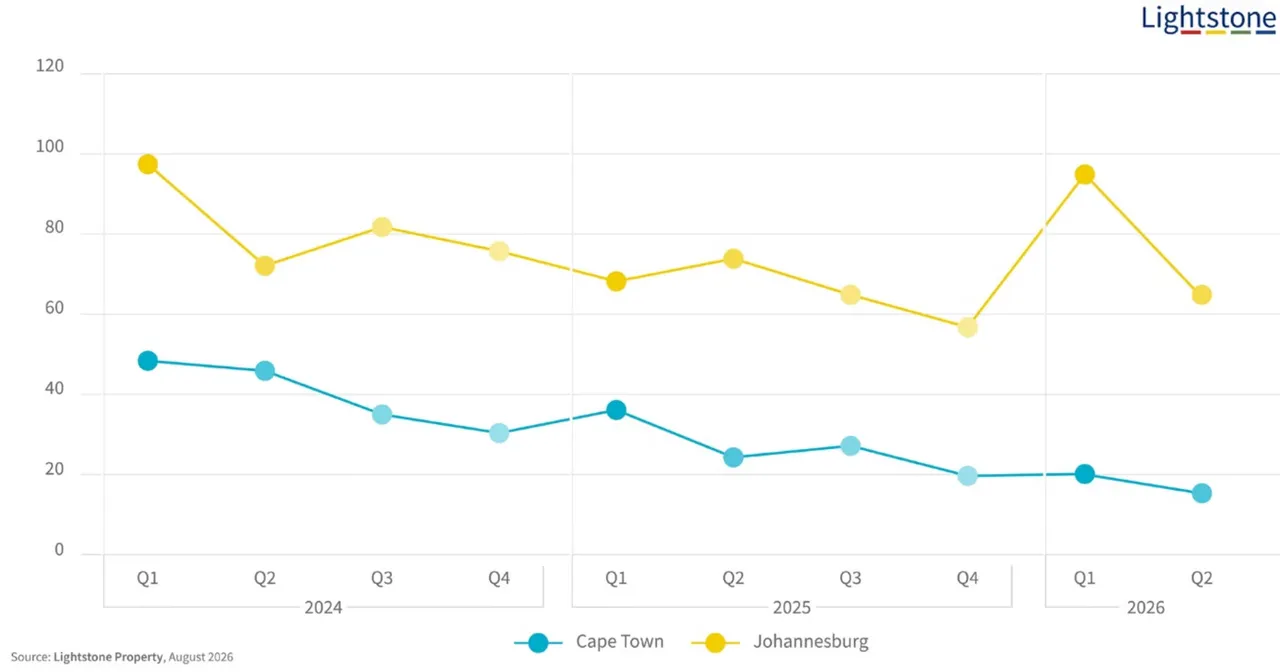
This is my second choice because it shows that the Cape Town-Johannesburg gap isn't merely a single-quarter phenomenon.
The middle of the market is moving fastest
National data provides another important insight: neither the cheapest nor the most expensive properties necessarily sell fastest.
During Q1 and Q2 2026, properties between approximately R1 million and R4 million generally recorded the shortest selling periods, while properties between R500,000 and R1 million took longer.
There has, however, been improvement at the lowest end. “In Q1 2024 it was listings under R500 000 which took longest to sell, and this price band has dropped to 59 days in Q2 2026 from a high of 92 days in Q4 2025. However, this situation may change as data from the Deeds Office flows through,” says Marx.
Overall, Lightstone's data suggests properties at both extremes; below R1 million and above R6 million, tend to require longer selling periods than much of the middle market.
This is significant for investors because liquidity should form part of the acquisition decision alongside rental income, capital growth and financing.
A property is only worth what another buyer is prepared and financially able to pay when an investor eventually needs to exit.
Cape Town sellers are holding closer to their asking prices
Speed isn't the only point of divergence. Lightstone also examined sales during Q4 2025 and Q1 2026 to establish how frequently sellers had to reduce their asking prices.
Again, Cape Town generally came out stronger. Johannesburg sellers were more likely to reduce their asking prices across most of the value bands analysed. The clearest difference occurred between R500,000 and R1 million.
“Sellers in Johannesburg of properties listed between R500 000 and R1 million were the most likely to reduce, at 40%, compared to 24% in Cape Town, followed by those selling properties listed between R1.5 million and R2 million,” says Marx.
At the luxury end, however, the picture changes. Among properties above R6 million, 20% of Cape Town sellers reduced their asking prices compared with 19% in Johannesburg, the only value band in which Johannesburg performed better on this measure.
One explanation could be Cape Town's strong luxury market encouraging some sellers to enter the market with ambitious initial asking prices.
Percentage of sellers reducing asking price: Cape Town vs Johannesburg - Q4 2025 to Q1 2026
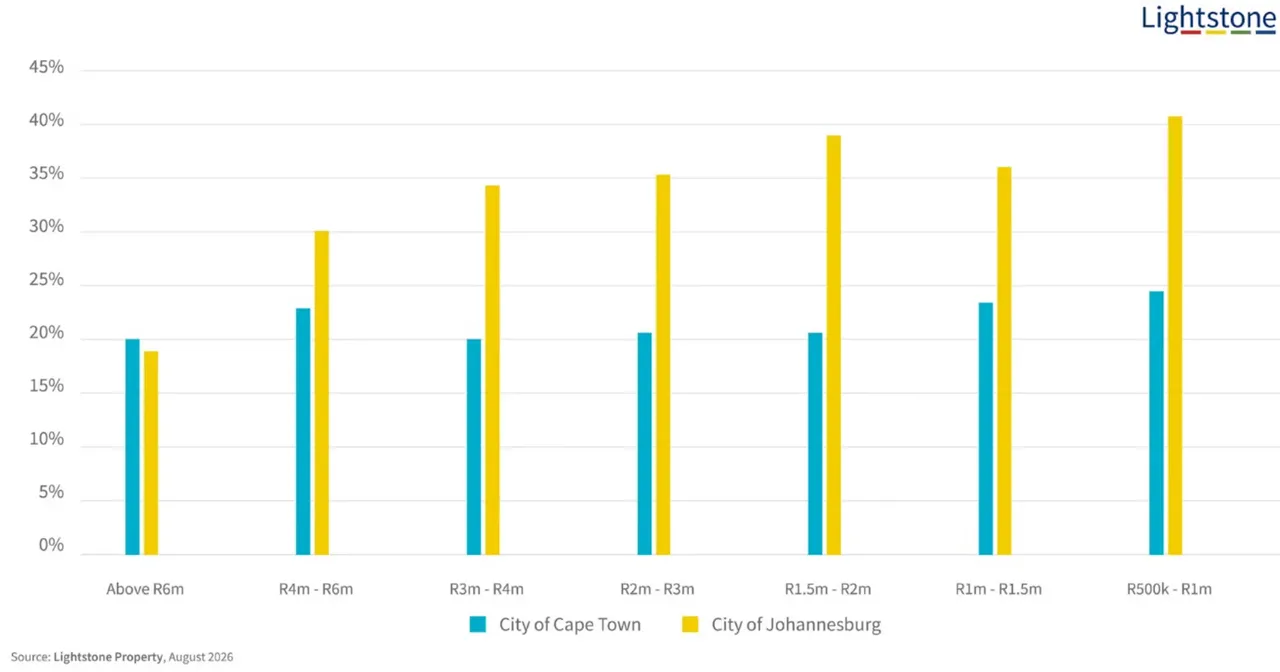
I'd select this rather than publishing all three asking-price graphs. It gives readers the clearest demonstration of seller confidence and negotiating power.
Johannesburg gives buyers more room to negotiate
The pattern continues when buyer offers are examined. A greater proportion of Johannesburg buyers submitted offers below the listing price than buyers in Cape Town, reinforcing the picture of stronger seller negotiating power in the Mother City.
But there is an important distinction between how often sellers reduce their price and how much they reduce it by. Where reductions occurred, they were generally within a relatively narrow range of approximately 6% to 9.5% across both cities.
Johannesburg sellers recorded the deeper reduction in five of the seven price bands. The biggest was among properties between R1 million and R1.5 million, where reductions reached 9.4%.
At more than R6 million, the pattern reversed. Cape Town sellers who reduced their price came down by 9.3%, compared with 8.4% in Johannesburg.
That reinforces an interesting feature of Cape Town's premium market: sellers may be confident enough to test higher asking prices initially and negotiate where necessary. The more significant difference between the cities, therefore, isn't necessarily the size of the eventual discount. It's how frequently a discount is required at all.
What this means for property investors
The Lightstone data reinforces a widening difference in residential market dynamics between Cape Town and Johannesburg.
Cape Town currently demonstrates stronger liquidity, faster transactions and greater seller pricing power across much of the market.
Johannesburg presents a different proposition. Longer selling periods and more frequent price reductions indicate greater negotiating power for buyers and that can create opportunities for investors capable of identifying undervalued assets and buying at the right price.
So this isn't necessarily a simple case of Cape Town good, Johannesburg bad. For investors, Cape Town's stronger market can mean easier exits and capital-growth potential, but it can also mean higher acquisition prices and greater competition.
Johannesburg's weaker pricing power can increase exit risk, but potentially create better entry points and stronger yields where investors buy selectively.
The key is to understand what the data is telling you. Purchase price determines the entry. Rental income determines the hold. Market liquidity determines how easily you can eventually get out.
And right now, when it comes to residential liquidity, Cape Town is clearly moving faster.
Note: Deeds Office transactions are typically recorded around three months after an offer to purchase is signed. Lightstone cautions that Q2 2026 sales data is therefore not yet complete.