









R1m buys less house as SA property prices lag inflation
Listen · 1-minute summary
0:00 / 1:24
Read the summary
R1m buys less house as SA property prices lag inflation. Over the past ten years, freehold property prices in South Africa rose 41 percent, and sectional-title prices rose 29 percent, both lagging inflation, which climbed 59 percent. That means a R1 million budget now buys far less than it used to. New research from Lightstone shows that in 2016, four in five freehold houses in mid-value areas sold for R1 million or less. Today, fewer than half do. In high-value areas, the drop is sharper, from one in three homes down to fewer than one in ten. Buyers are also shifting toward sectional title, which now makes up 53 percent of R1 million transactions, up from 41 percent a decade ago. Along the way, properties have shrunk. A typical R1 million freehold house in a mid-value area is now 40 square metres smaller, with a stand 180 square metres smaller than ten years ago. Regionally, Cape Town flat prices jumped 64 percent, while Johannesburg's rose just 7 percent, leaving Johannesburg more affordable by comparison. Read the full story by Neale Petersen on rei.co.za.

New Lightstone research reveals how a R1 million property budget has changed over ten years, why buyers are sacrificing space and where South Africa's best-value markets remain.
- Freehold prices rose 41% and sectional-title prices 29% over ten years, both trailing inflation of 59%.
- A R1 million budget now buys smaller homes, less land and fewer bedrooms, particularly in higher-value areas.
- Cape Town and coastal markets recorded strong price growth, while Johannesburg offers comparatively greater buying power for residential investors.
The R1 million property dilemma: Less house or more money?
What could R1 million buy in South Africa ten years ago and what will that same investment secure today? New research from property data company Lightstone reveals a changing residential market in which buyers are increasingly forced to choose between location, property size and affordability.
Between 2016 and 2026, Lightstone's House Price Index shows that freehold property prices increased by approximately 41%, while sectional-title prices rose by 29%. A freehold house worth R1 million in 2016 would therefore be worth approximately R1.41 million today, while an equivalent sectional-title unit would be valued at R1.29 million. Yet both property categories have significantly underperformed headline inflation of 59%.
For homeowners, this creates an interesting contradiction: property has become more expensive in nominal terms, but comparatively cheaper than many everyday goods and services.
For investors, the figures raise important questions about capital appreciation, affordability and which markets offer the strongest long-term opportunities.
Property versus inflation: The surprising comparison
Lightstone's analysis shows that residential property price growth has been relatively modest compared with increases in household living costs.
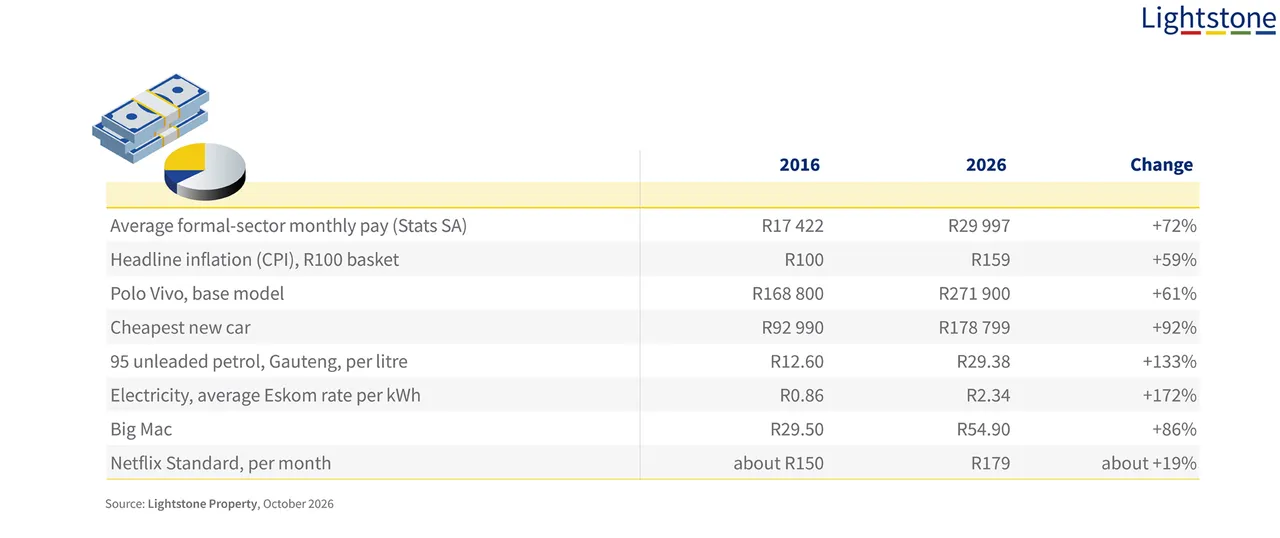
The key findings include:
- Sectional-title prices: Increased 29%.
- Freehold prices: Increased 41%.
- Headline inflation: Increased 59%.
- Average formal-sector earnings: Increased 72%.
- Big Mac prices: Increased 86%.
- Petrol and electricity: Both more than doubled, with electricity increasing particularly sharply.
Although formal-sector earnings rose faster than property prices, households also face substantially higher transport, electricity and living expenses. This helps explain why improved relative property affordability does not necessarily translate into easier homeownership.
R1 million buys fewer freehold houses
The purchasing power of R1 million has declined across most residential property categories, particularly in higher-value areas.
Lightstone found that in mid-value areas, R1 million could purchase approximately four out of five freehold houses sold in 2016. Today, it buys fewer than half.
In high-value areas, the change is even more pronounced.
- 2016: Approximately one in three freehold houses sold for R1 million or less.
- 2026: Fewer than one in ten fall within that budget.
- Sectional title: In mid-value areas, more than eight in ten units remain accessible at R1 million, although the proportion has declined.
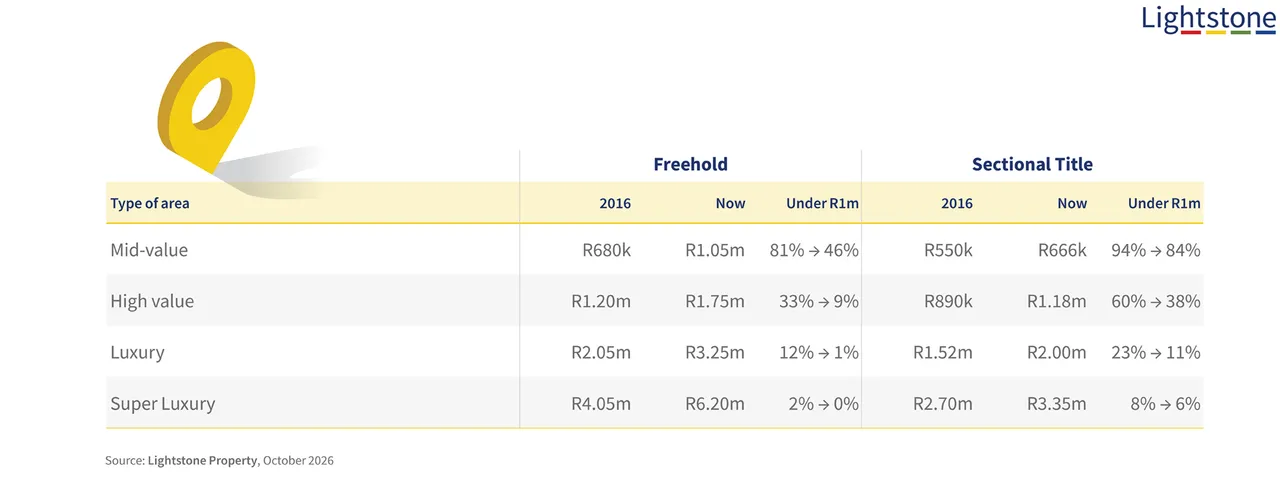
The implication is clear: buyers wanting to remain in established, higher-value neighbourhoods increasingly need to compromise on property type or increase their budgets.
Sectional title overtakes freehold at R1 million
One of the most significant changes is the shift towards sectional-title ownership within the R1 million market.
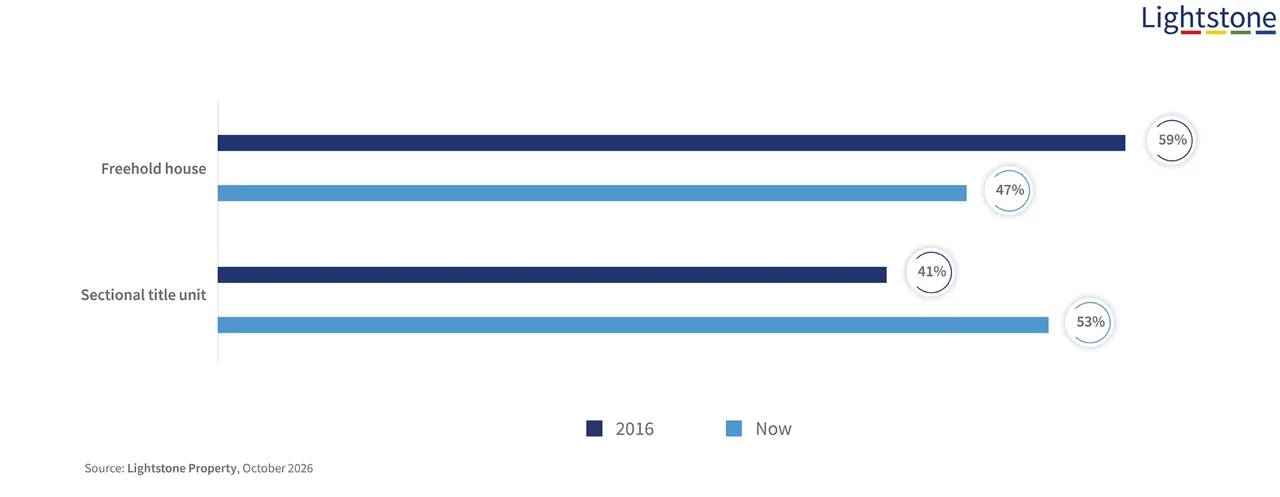
In 2016, freehold houses accounted for 59% of R1 million transactions, compared with 41% for sectional-title units. By 2026, the balance had reversed:
- Sectional title: 53% of transactions.
- Freehold: 47% of transactions.
The shift reflects changing purchasing power and buyers' willingness to sacrifice land ownership or living space to remain in desirable locations.
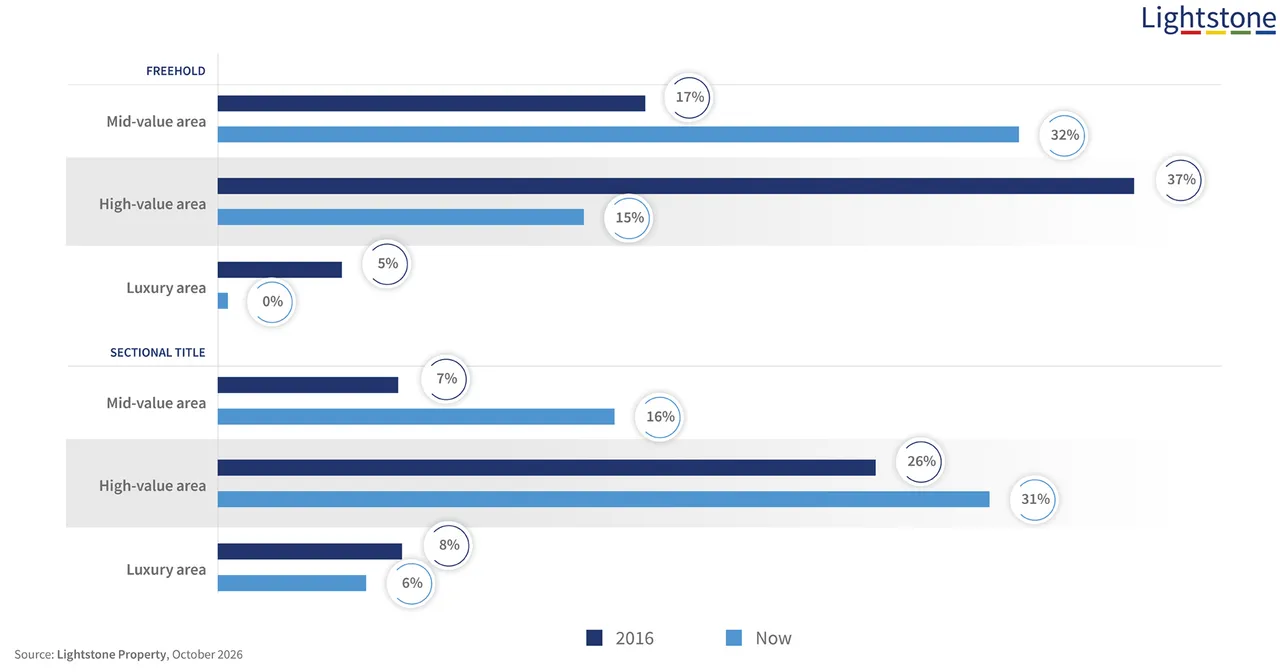
A decade ago, a freehold house in a high-value area was a common R1 million purchase. Today, buyers are more likely to choose between a freehold house in a mid-value area and a sectional-title unit in a higher-value location.
Smaller homes, stands and fewer bedrooms
Perhaps the most tangible change is how much physical property R1 million now buys. Lightstone's research shows that buyers are sacrificing floor space, land and, in some cases, entire rooms.
Key changes include:
- Freehold houses: In mid-value areas, a typical R1 million house is approximately 40 m² smaller than in 2016.
- Stand sizes: The typical erf is around 180 m² smaller.
- Sectional-title units: A typical R1 million apartment in a mid-value area is approximately 25 m² smaller.
- Bedrooms: Buyers who could previously afford three-bedroom apartments are now more likely to purchase two-bedroom units.
- Bathrooms: The proportion of R1 million sectional-title units with a second bathroom has fallen from approximately 75% to 50%.
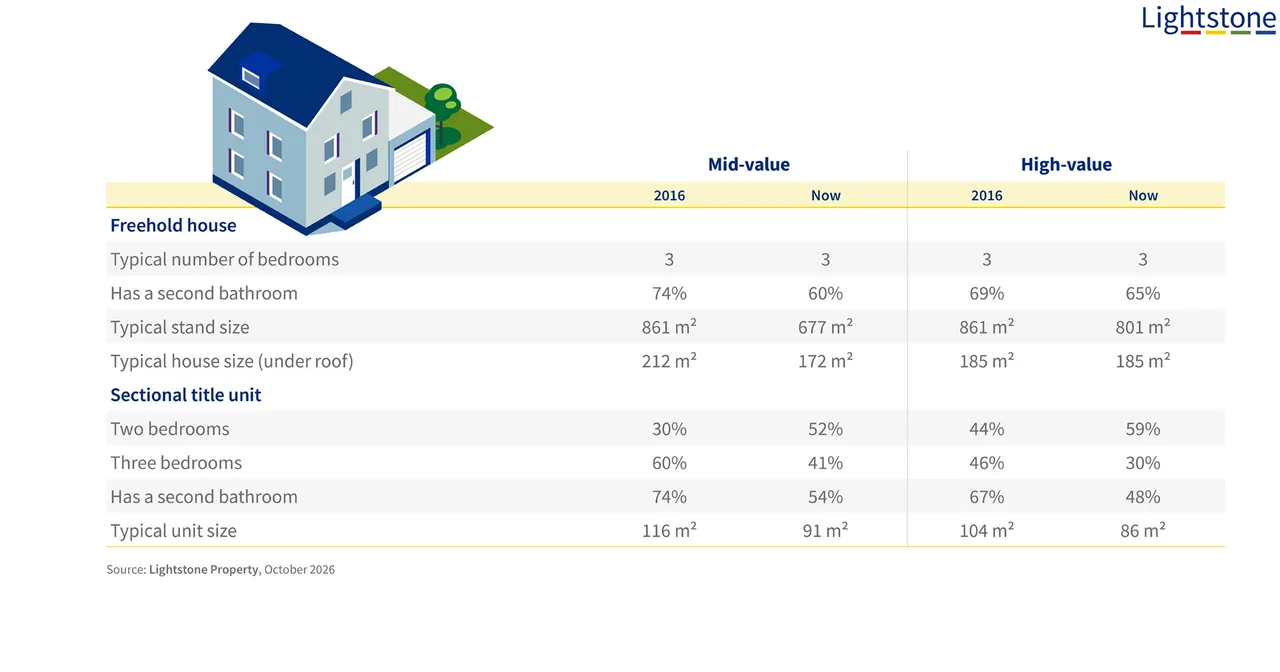
For investors, these changes matter because floor area, bedroom configuration and location influence tenant demand, rental affordability and resale prospects.
Cape Town versus Johannesburg: Two different markets
Lightstone's regional analysis reveals substantial differences in residential property performance.
Cape Town and several coastal markets have recorded strong price growth, while Johannesburg's sectional-title market has remained comparatively subdued.
- Cape Town flat price growth, 2016–2026: +64%
- Johannesburg flat price growth, 2016–2026: +7%
The contrasting performances reveal several important trends:
- Johannesburg: Typical sectional-title prices increased only around 7%. R1 million still buys more than half the flats sold.
- Cape Town: Prices increased approximately 64%. R1 million now buys roughly one in five flats, compared with around half in 2016.
- Garden Route, Hermanus and Jeffreys Bay: Prices more than doubled in the markets analysed.
- Ballito and KZN South Coast: Growth was more subdued than in the strongest Western Cape coastal markets.
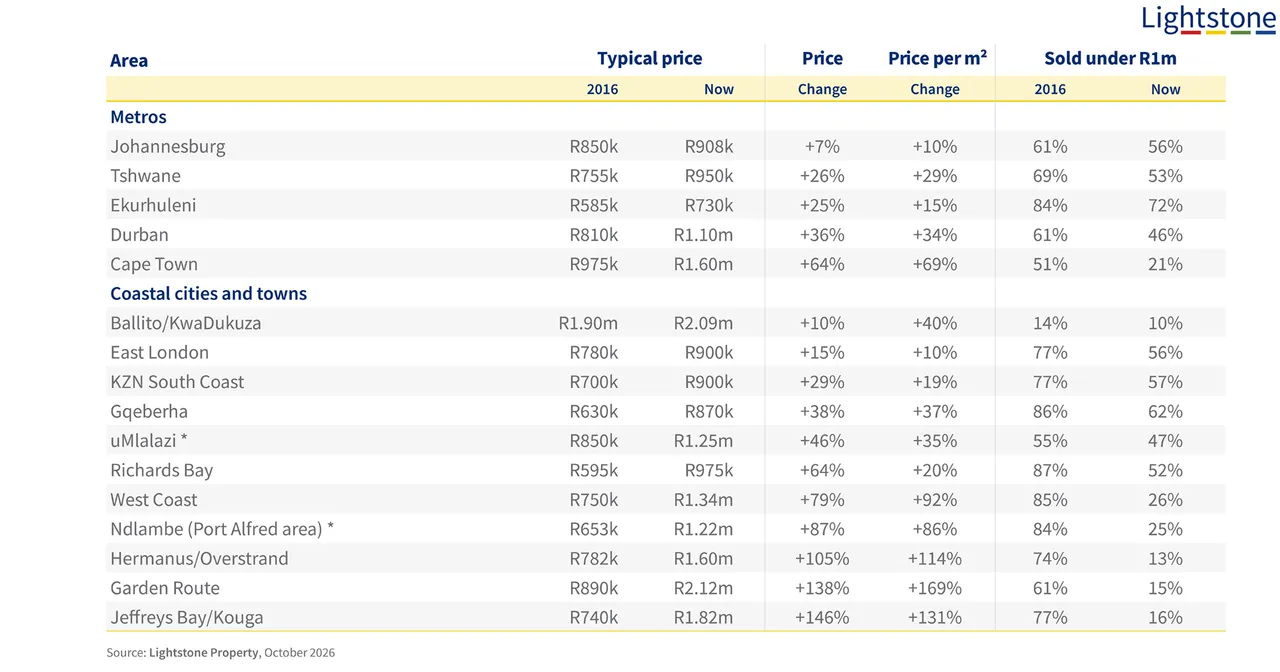
The figures suggest Johannesburg may offer comparatively attractive entry prices, while Cape Town's stronger historical appreciation has reduced affordability.
However, lower prices do not automatically mean stronger investment returns. Investors must also consider rental yields, vacancies, municipal services and future demand.
Suburb-level opportunities: Where R1m still stretches
Lightstone's suburb-level analysis identifies pockets of relative affordability and significant differences in capital appreciation.
In Johannesburg, suburbs including Paulshof, Sunninghill, Douglasdale and Beverley recorded typical sectional-title transaction prices below their 2016 levels. Glenferness and Magaliessig also showed price declines in the comparison of suburbs where typical flats sold for around R1 million in 2026.
Elsewhere, the picture differs:
- Mulbarton, Johannesburg: Typical flat prices increased from approximately R700,000 to just over R1 million.
- Pretoriuspark Extension 32, Tshwane: Prices rose from approximately R435,000 to just over R1 million.
- Observatory and Woodstock, Cape Town: Typical flat prices increased by around 40% or more.
- Keurboomstrand, near Plettenberg Bay: Prices increased approximately 140%.
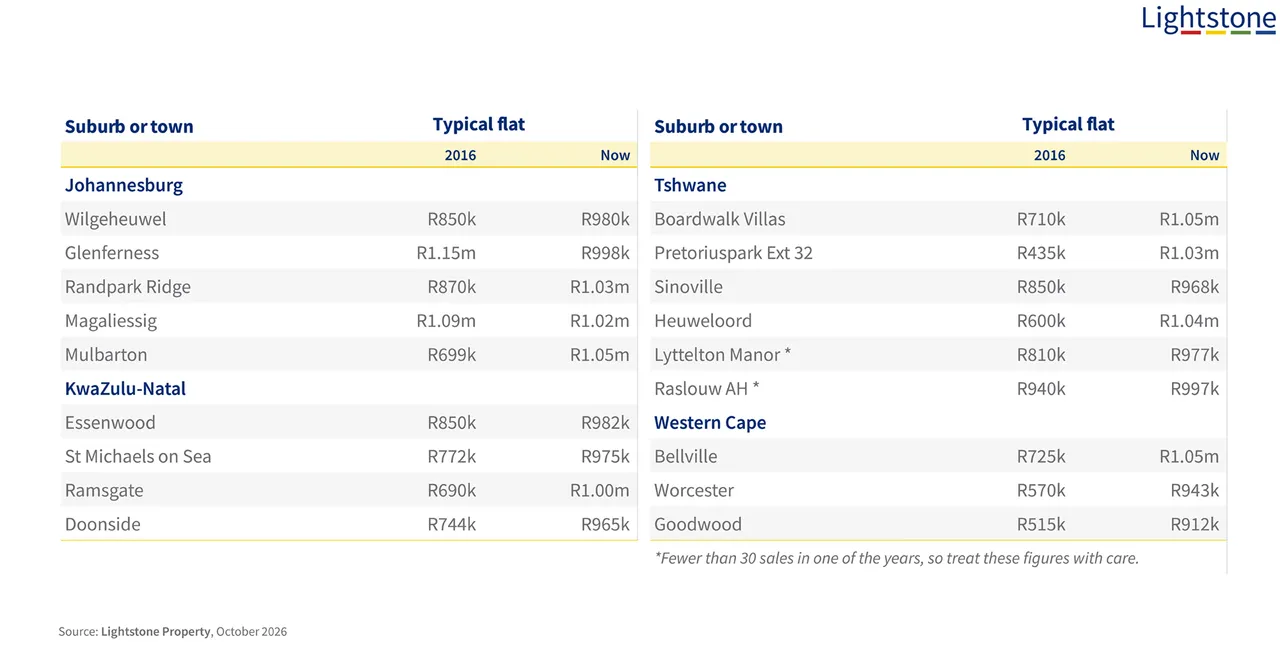
These comparisons reflect the properties actually sold in each period. Changes in the size or quality of units sold may influence the results, so they should not automatically be interpreted as like-for-like capital appreciation.
What this means for property investors
Lightstone's findings reinforce three important investment considerations.
- Affordability is increasingly location-dependent
A R1 million budget offers substantially different opportunities across South Africa's metropolitan and coastal markets. - Sectional-title properties are becoming more important
Their growing share of entry-level transactions highlights the relevance of apartments and townhouses to both homeowners and residential investors. - Capital growth is not guaranteed
Some markets have delivered strong nominal appreciation, while others have experienced stagnant or declining prices, even before accounting for inflation.
Investors should therefore assess rental yields, holding costs, body corporate finances, location fundamentals and long-term demand rather than relying solely on historical property price growth.
REI perspective: Value matters more than price
The biggest lesson from Lightstone's ten-year analysis is that property affordability cannot be measured by purchase price alone.
A R1 million property today may offer less space than a decade ago, but residential property prices have also increased more slowly than inflation and many household expenses.
For buyers, the challenge is balancing affordability, location and lifestyle. For investors, the opportunity lies in identifying markets where purchase prices remain attractive relative to achievable rental income and sustainable long-term demand.
Johannesburg's comparatively subdued prices may create selective opportunities for yield-focused investors, while Cape Town and coastal markets demonstrate the effects of stronger demand on capital values and affordability.
Ultimately, the smartest property investment is not necessarily the biggest house or the most expensive location, but the asset that offers the strongest combination of price, income, risk and future growth potential.
Source and methodology: Lightstone House Price Index and deeds registry analysis. Transactions registered in 2016 compared with September 2025–August 2026. Typical prices refer to medians. The study excludes non-market transfers, vacant land and certain other transaction categories. Lightstone's area classifications exclude many township and RDP housing markets.